Visual Datastream Processing is a web-based graphical interface that provides a visual canvas for users to design and build IoT applications without coding.
The powerful tool, provides a very intuitive way to link sensor information to devices and components that process data through functions and predefined functions and operations provided by the Visual Data Flow Manager.
These can ultimately be represented in graphs, data tables, dashboards and other platforms.
Technologically design to create drag and drop components and flow and section creation (pages).
Visual Data Flow Manager is nurtured from connected databases through SocketIO granting the access to information in real time. SocketIO technology allows collaborative flow creation and screen visualization. More than 1 user can be working on the same flow simultaneously and devices and hubs can be added to the same project at the same time.
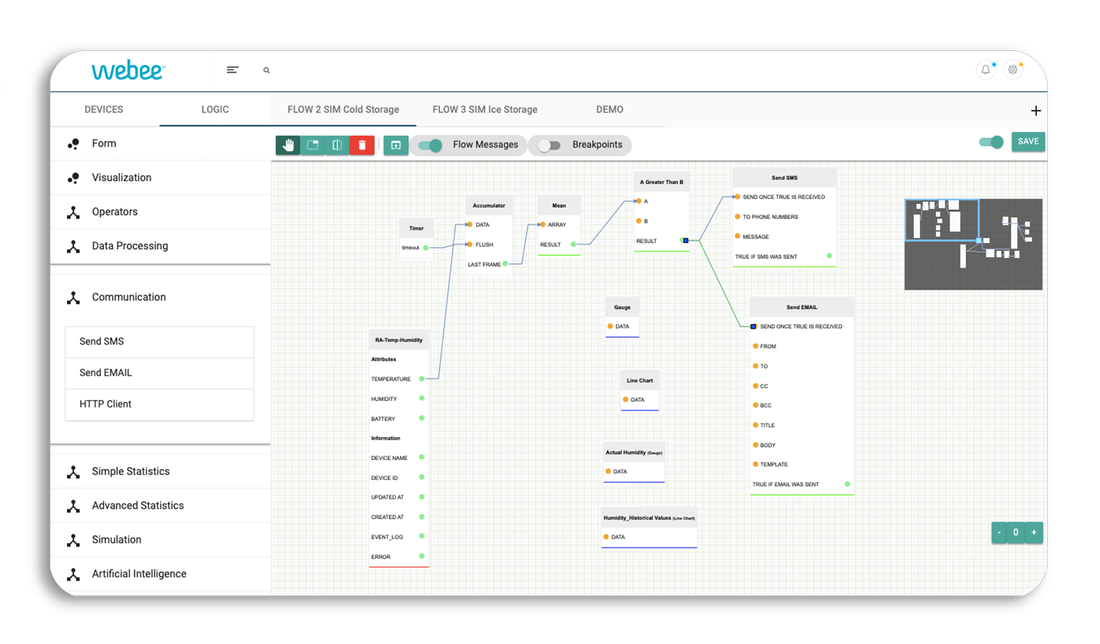
The Visual IoT Designer provides a visual canvas to design and build your IoT applications. This powerful tool helps to develop IOT use case scenarios in minutes that can be simulated and tested before they are implemented.
- Visually connect devices to logic maps.
- Easily plug conditional and data transformation objects into the logic map
- Visually create field-level integration between devices
- Integrate artificial intelligence and machine learning models into the logic maps
- Create templates from existing IoT logic maps
- Execute IoT logic maps real-time or on a scheduled basis
Functions and features
|
Import and enable devices for your projects.
Input data components:
Visualization
Operators
|
Data processing
Communications
AI Debugging |


